Data is important in understanding where you community is at in its sustainability efforts. Some of the main data tracking and visualization tools are below.
“If you don’t measure results, you can’t tell success from failure. If you can’t see success, you can’t reward it. If you can’t see failure, you can’t correct it.”
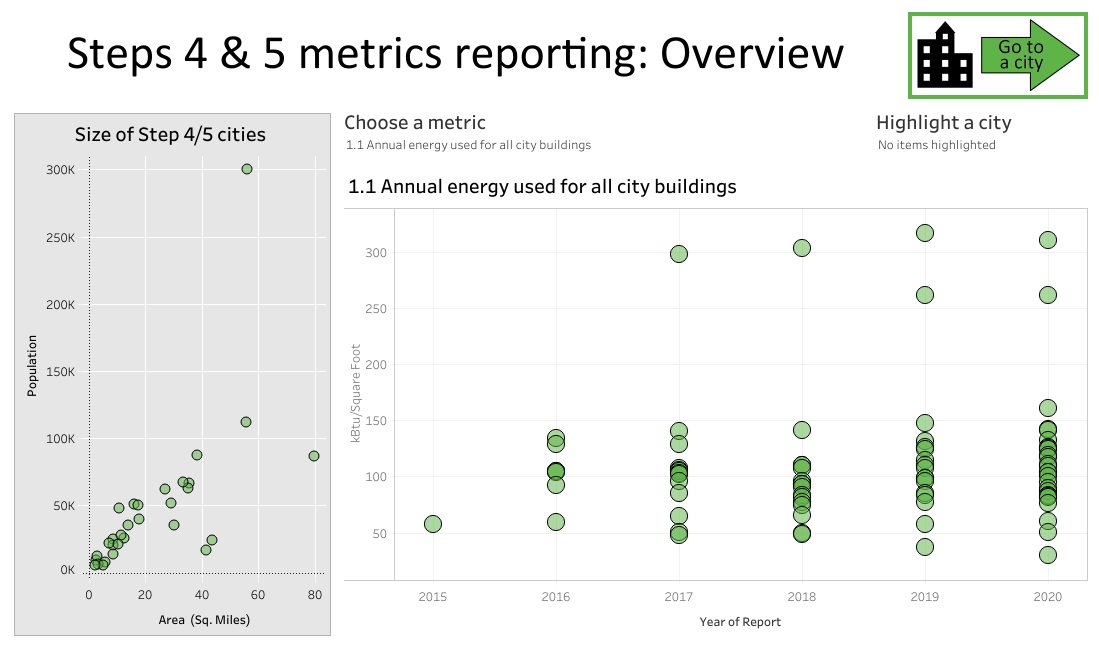
Steps 4 and 5 - Metrics, Targets, and OutcomesThe primary purpose and benefit of Steps 4 and 5 is for participants to track and celebrate outcomes that best practice actions have had on your community over time. Participants track goals, targets, and outcomes through metric-based data that can help identify trends over time and prioritize best practice actions to plan for. Find reports linked on individual community pages. You can view 21 of the key metrics that Step 4 and 5 communities have reported on the Step 4 & 5 Metric Dashboard. The tool is updated annually as communities voluntarily report their metrics. For more information on data related to metrics reporting, see the Step 4 & 5 guidance documents. |
|
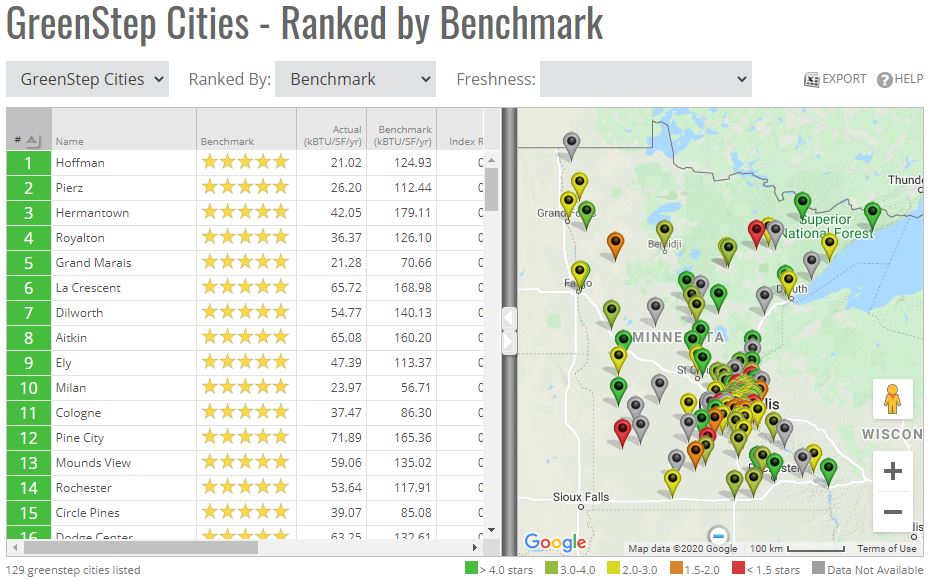
B3 BenchmarkingDeveloped by the State of Minnesota as a free tool to assist Minnesota public building owners to manage and reduce energy costs. B3 Benchmarking provides benchmarking energy modeling, peer comparisons, ENERGY STAR® scores, target tracking, and dynamic reporting. GreenStep communities are encouraged to use the tool regularly and have their own account to review detailed information about the performance of their buildings. To see how GreenStep Cities compare according to the public data, see the B3 Benchmarking Rankings. |
|
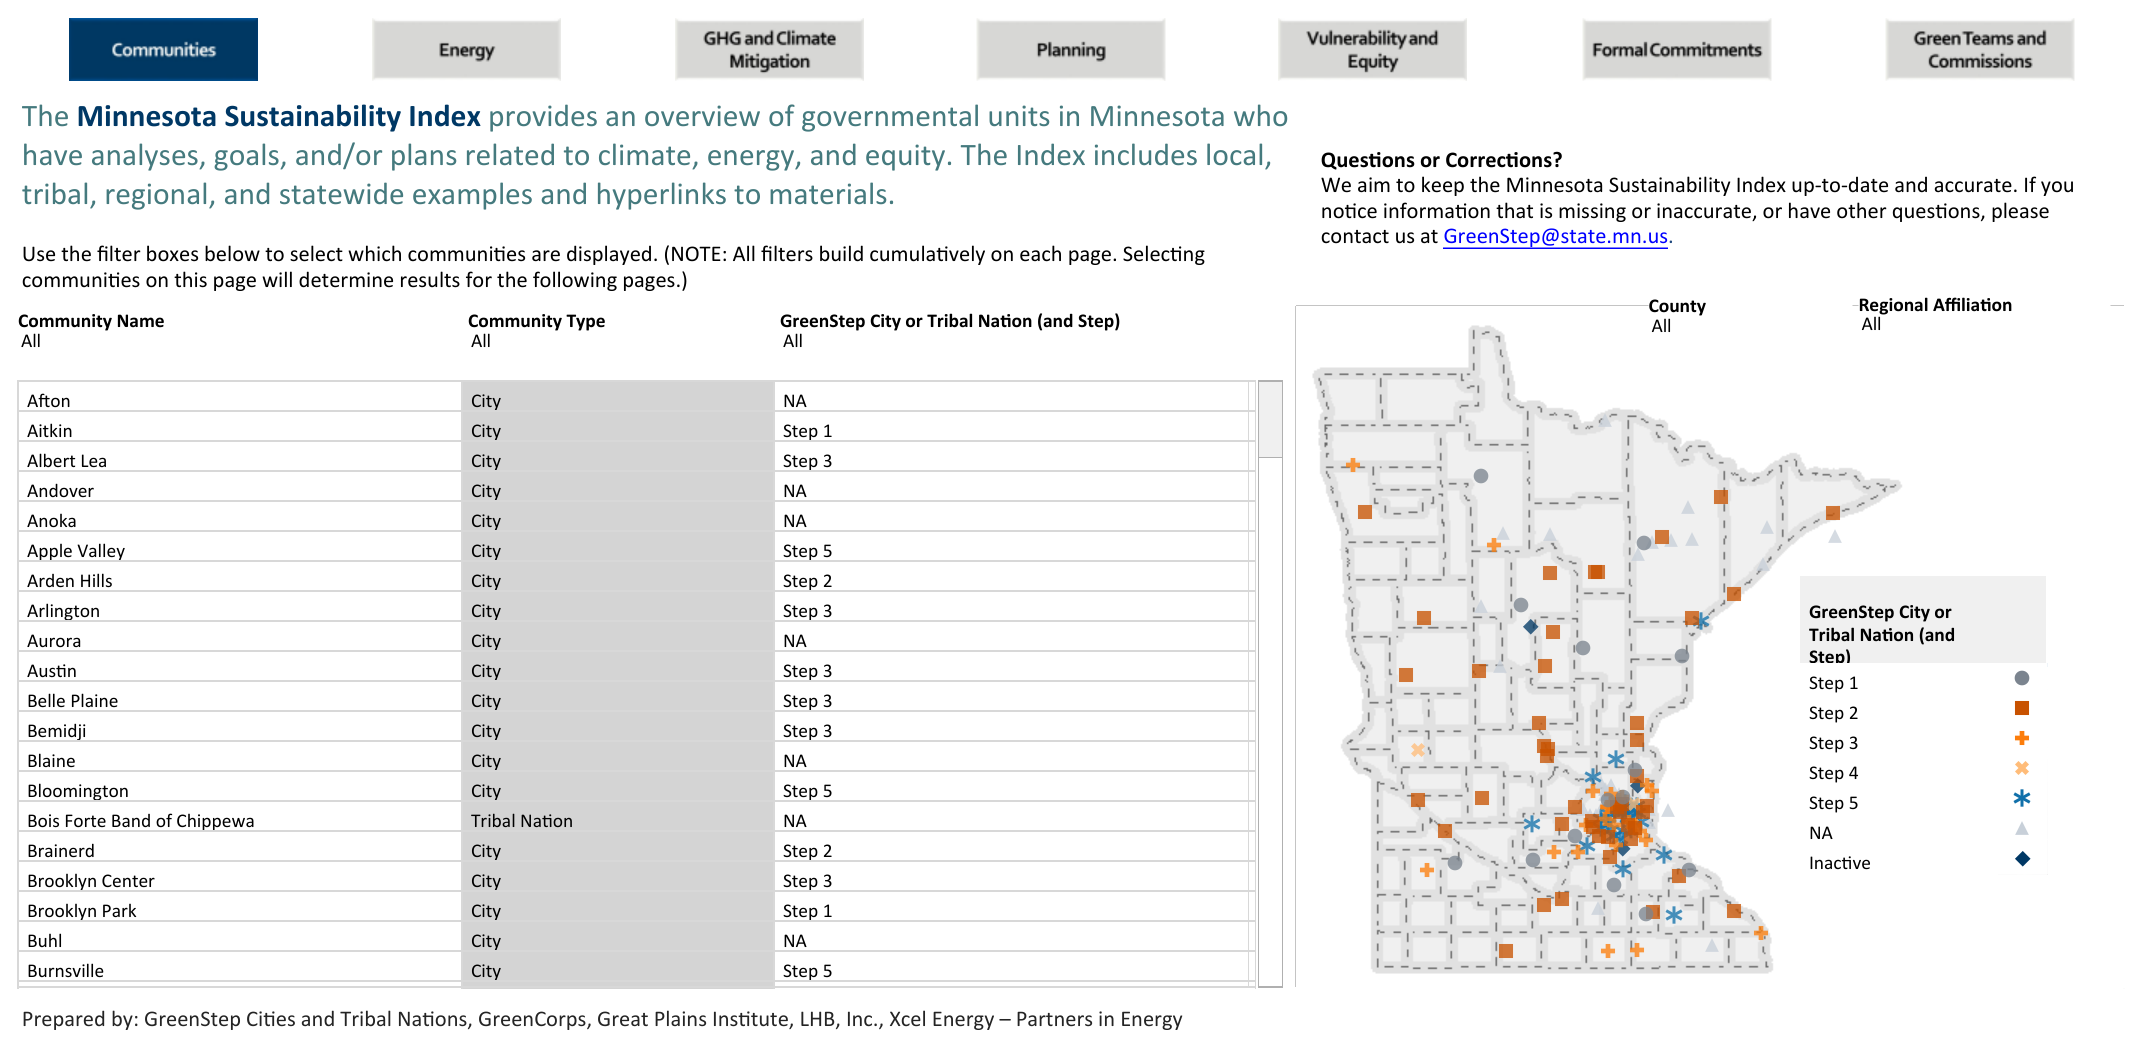
Minnesota Sustainability IndexTrack governmental units in Minnesota who have analyses, goals, and/or plans related to climate, energy, and equity. The index includes local, tribal, regional, and statewide examples and hyperlinks to materials.
|
|
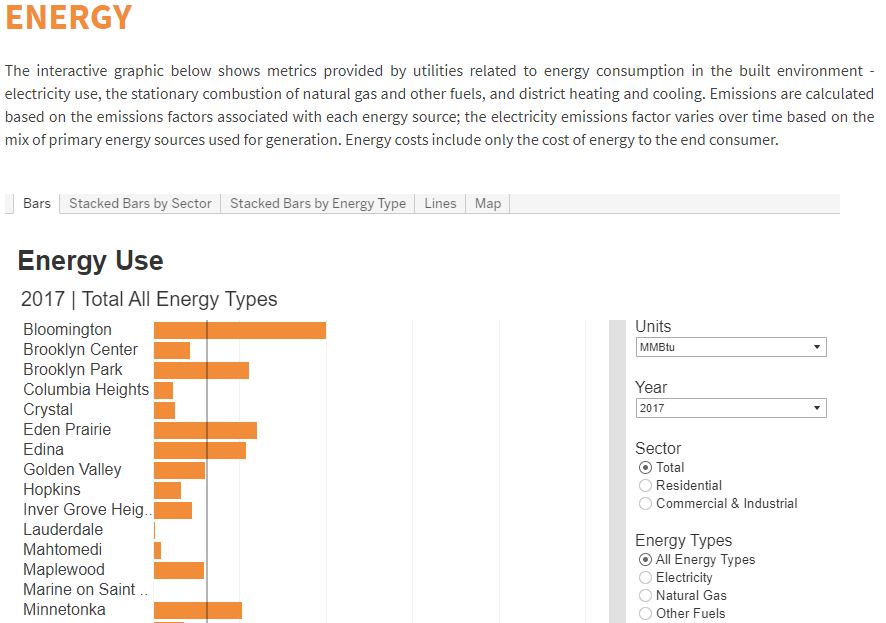
Community-Wide Greenhouse Gas Emissions Tools - Minnesota specificThe Regional Indicators Initiative measures annual performance metrics for Minnesota cities committed to increasing their overall efficiency and level of sustainability. The initiative, developed and managed by LHB, collects city-wide data to measure progress of four indicators: energy, water, travel, and waste. The data is then analyzed to provide a free carbon baseline assessment for greenhouse gas emissions. Cities may request a data update for a fee. The Twin Cities Greenhouse Gas Inventory summarizes the sources of emissions by jurisdiction and tracks how greenhouse gas emissions are changing over time. The inventory, developed by the Metropolitan Council, is available to all metropolitan area cities and townships (counties to come) and includes seven sectors: transportation, energy, solid waste, wastewater, agriculture, land use, and environmental justice. NOTE: This tool is still under development. Only 2018 data is provided for only some sectors. |
|
Community/Municipal Operations Greenhouse Gas Emissions Tool - Minnesota specificStep 4 & 5 cities reporting metrics include data for operations (facilities, fleet, renewable energy production) that provide a free, basic operations assessment. Data can be entered in the Step 4&5 Metrics Worksheet and guidance is available for more details. |
 |